
Tenant Satisfaction Measures Results
Our internal reporting measures on the tenant services we provide.
Measuring our service performance.
The Tenant Satisfaction Measures (TSMs) have been introduced by the Regulator of Social Housing (RSH) in England to evaluate the performance of housing associations in England regarding the provision of high-quality homes and services. As part of this system, landlords will be required to report on a set of tenant satisfaction measures.
At SHA, we are dedicated to providing the best possible housing experience for all our valued residents. Below, we present management information (e.g. data on repairs and complaints) collected up to April 2026.
* Note: Data from Tenants Satisfaction Measures (TSM) results are based on the most recent survey data of 2024–2025. SHA conducts TSM surveys once every two years in accordance with Housing Ombudsman requirements. A TSM survey for 2026–2027 is currently underway. Results will be updated upon completion of the survey. SHA conducts TSM surveys once every two years in accordance with Housing Ombudsman requirements.
A TSM survey for 2026–2027 is currently underway, and the results will be updated upon completion of the survey in 2027.
2026/27 Results
Keeping homes in good repair
RP01
Proportion of homes that do not meet the Decent Homes Standard.
0%
RP02 (1)
Proportion of non-emergency responsive repairs completed within the landlord’s target timescale.
97%
RP02 (2)
Proportion of emergency responsive repairs completed within the landlord’s target timescale.
99%
Maintaining building safety
BS01
Proportion of homes for which all required gas safety checks have been carried out.
100%
BS02
Proportion of homes for which all required fire risk assessments have been carried out.
100%
BS03
Proportion of homes for which all required asbestos management surveys or re-inspections have been carried out.
N/A
BS04
Proportion of homes for which all required legionella risk assessments have been carried out.
100%
BS05
Proportion of homes for which all required communal passenger lift safety checks have been carried out.
100%
Complaints handling and neighbourhood management

Tenant Satisfaction Measures 2024/25 results
Overall satisfaction with the service provided by us
TP01 Overall Satisfaction: 68.6%
Keeping homes in good repair
- TP02 Satisfaction with repairs: 69.71%
- TP03 Satisfaction with time taken to complete most recent repair: 70.85%
- TP04 Satisfaction that the home is well maintained: 70.39%
- RP01 Proportion of homes that do not meet the Decent Homes Standard: 0%
- RP02 (1) Proportion of non-emergency responsive repairs completed within the landlord’s target timescale: 97%
- RP02 (2) Proportion of emergency responsive repairs completed within the landlord’s target timescale: 97%
Maintaining building safety
- TP05 Satisfaction that the home is safe: 65.3%
- BS01 Proportion of homes for which all required gas safety checks have been carried out: 100%
- BS02 Proportion of homes for which all required fire risk assessments have been carried out: 100%
- BS03 Proportion of homes for which all required asbestos management surveys or re-inspections have been carried out: N/A
- BS04 Proportion of homes for which all required legionella risk assessments have been carried out: 100%
- BS05 Proportion of homes for which all required communal passenger lift safety checks have been carried out: 100%
Respectful and helpful engagement
- TP06 Satisfaction that the landlord listens to tenant views and acts upon them: 60.3%
- TP07 Satisfaction that the landlord keeps tenants informed about things that matter to them: 50.6%
- TP08 Agreement that the landlord treats tenants fairly and with respect: 73.6%
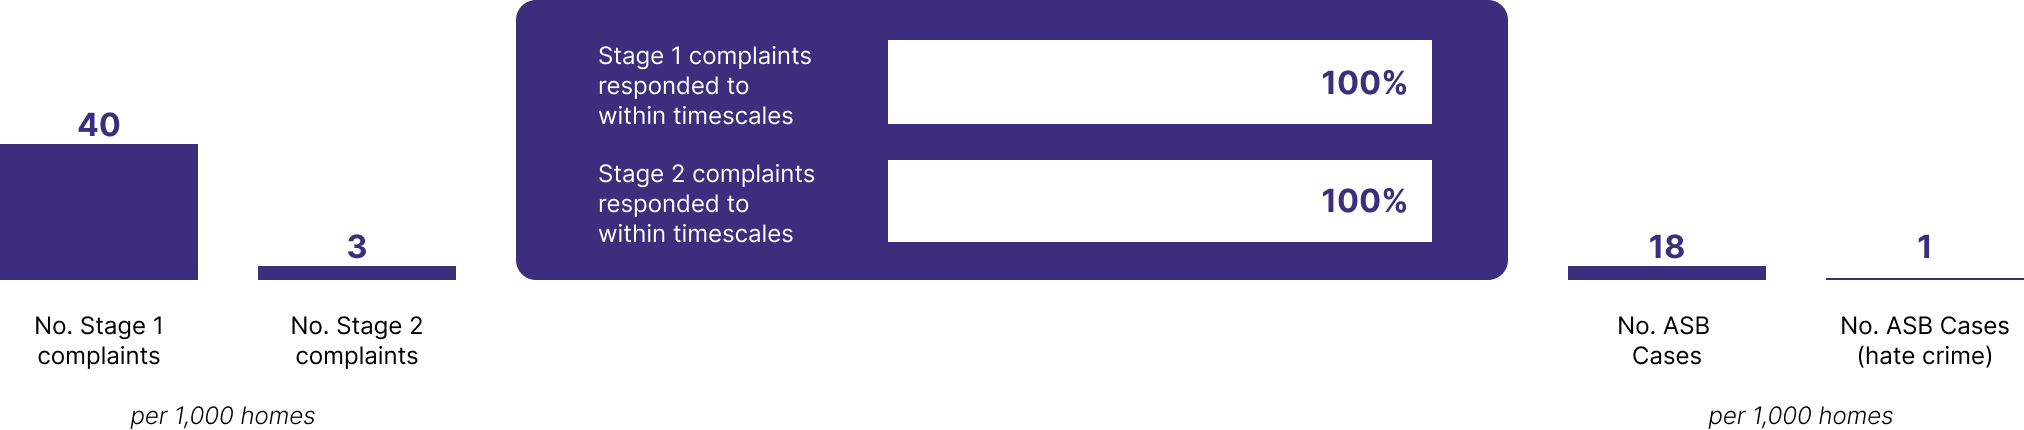
Complaints handling and neighbourhood management
TP09 Satisfaction with the landlord’s approach to handling complaints: 62.4%
Responsible neighbourhood management
- TP10 Satisfaction that the landlord keeps communal areas clean and well maintained: 69
- TP11 Satisfaction that the landlord makes a positive contribution to neighbourhoods: 58.2%
- TP12 Satisfaction with the landlord’s approach to handling anti-social behaviour: 57.4%
- NM01 (1) Number of anti-social behaviour cases opened per 1,000 homes: 37
- NM01 (2) Number of anti-social behaviour cases that involve hate incidents opened per 1,000 homes: 0